Last updated 2013-10-01 08:00 EDT.
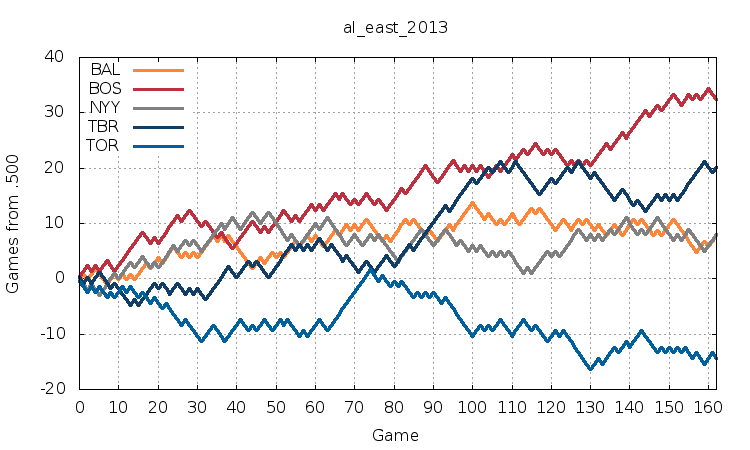
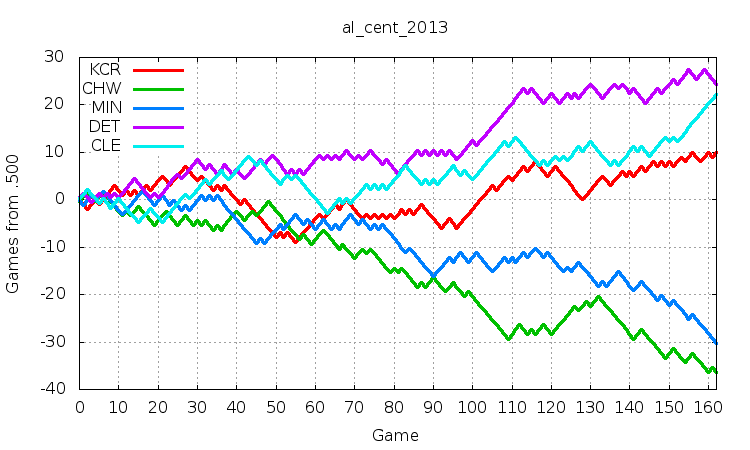
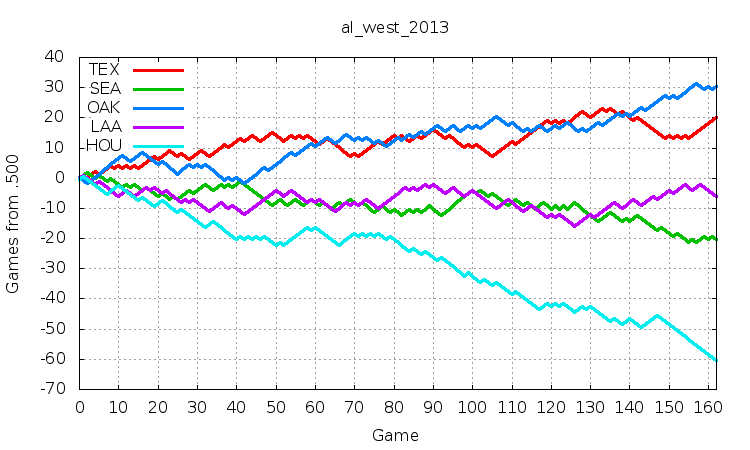
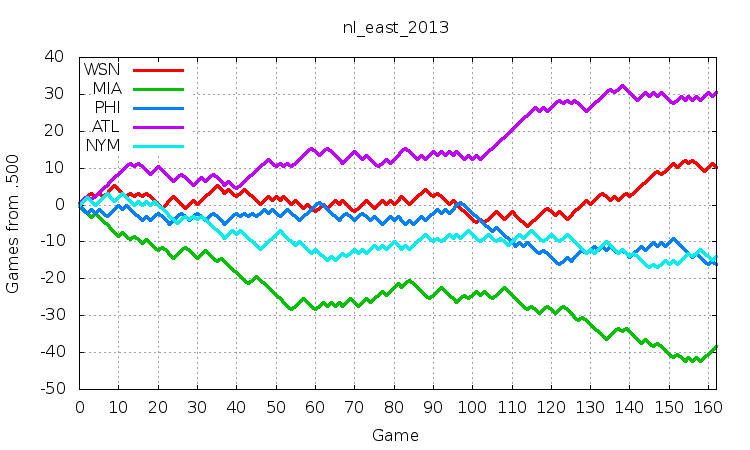
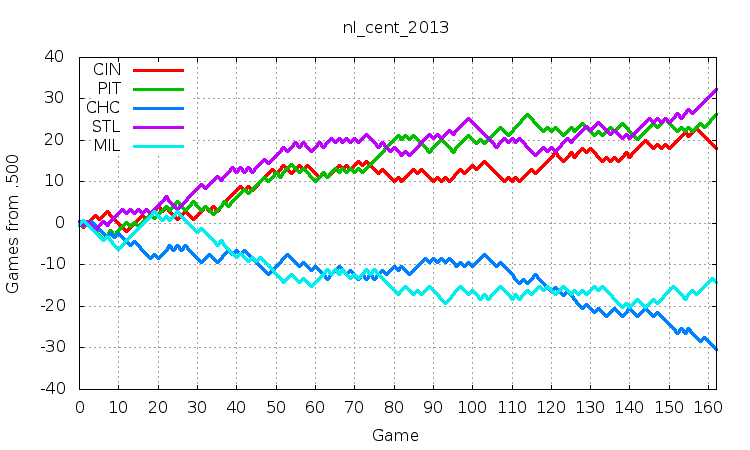
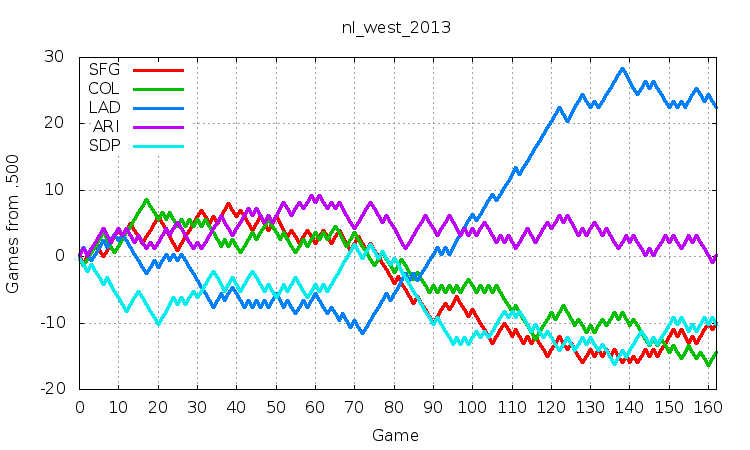
This page has MLB's 2013 baseball standings as graphs. These are generated each morning (Eastern Time), after the previous day's scores are reported at www.baseball-reference.com and related pages. A full description of the data is at my original runnings page that I wrote the year after the Red Sox won the World Series from the Yankees. Okay, it was the St. Louis Cardinals, but beating the Yankees after losing the first three games was much more impressive than winning the World Series in four games.
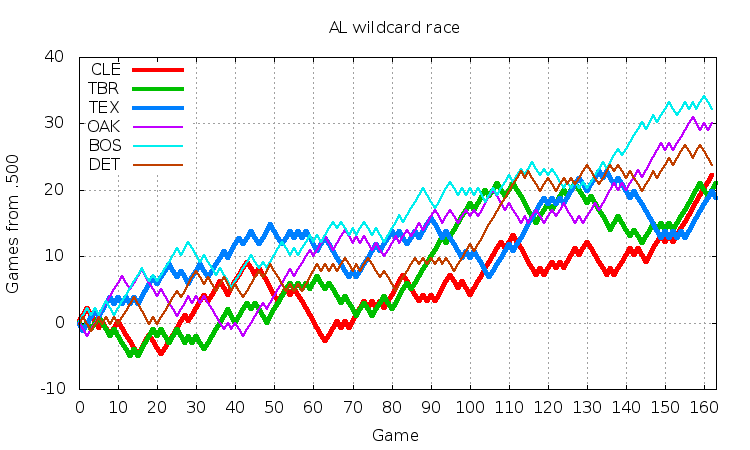
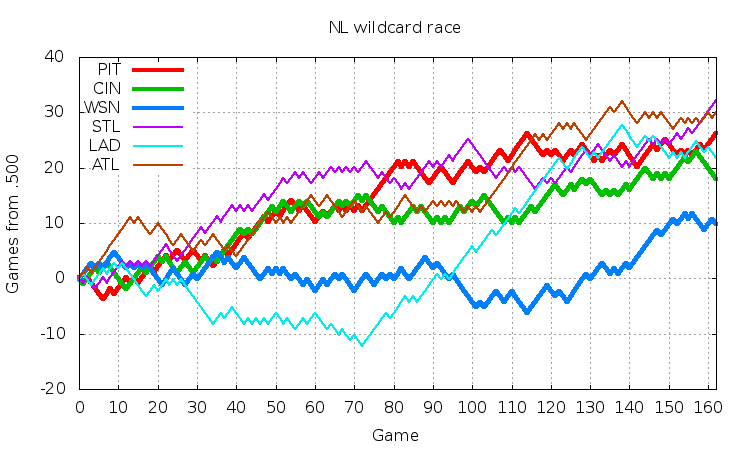
The interesting wildcard race in 2011 demonstrated I should include it all years. That year I simply tracked the best three contenders starting late in the season and I didn't have to change it.
The next season I added code to pick out the top contenders. Instead of watching the top four or five teams, I try to include contenders and other teams that are close in the standings. The graphs show the division leaders with narrow lines and contenders with thick lines. Note that some of the contenders can be well above the leader in another division.
The wildcard graphs aren't displayed in the first half of the season. Once we get past the All-Star game, interest in the races increases as the playoffs are now the next big event. By the way, Baseball Prospectus has an interesting standings list that shows the probability of the teams reaching the playoffs.
The 2013 wildcard code seemed to have worked just fine. It might have given up on the Yankees earlier than some Yankee fans would have liked, but it made the right decision as they Yankees never got back in playoff position.
I expect this will be back in 2014. See you then.
-Ric Werme

Contact Ric Werme or return to his home page.
Last updated 2013-10-01 08:00 EDT.