Traditionally, a winter's snowfall has been tracked as simply the total snow that falls during the season. While fine for several purposes, it doesn't really measure the impact of the snow on people. Suppose the total snowfall for a season is 100 inches. Near a coast where the ocean brings in warm, moist maritime air and rain, snow may not last for very long. Inland where arctic air dominates, the snow will last longer and the maximum snow depth can be much greater than near the coast.
The type of snow also has differing impacts. A foot of dry, fluffy snow will compress quickly with time (or with more snow) whereas an equal depth of wet snow presents more challenges to driving, shoveling, compression and melting.
Snow Depth Days makes a better measure of impact a winter's snows. The depth days for a whole winter are simply the sum of the snow depth on the ground for each day of the winter. Storms that start with snow and change to rain count for less than storms that are all snow.
Two major blizzards in Massachusetts show the importance of the depth day metric. If you experienced both the Blizzard of '78 and the April Fool's Blizzard of '97, the 1978 storm wins hands down despite surprisingly similar snow distributions. The key differences were the winds (1978 saw major coastal destruction), the weight of the snow (1997 took a heavier toll on tree limbs), and how long the snow remained. Massachusetts was shut down for a week in 1978, but the 1997 snow melted in days. 1997's storm brought far fewer depth days.
A couple weeks before the 1978 storm, on Jan 20th, a storm left 22" of snow in Boston, a January record and 24 hour record. While a rain storm on Jan 26 melted most of the snow in Boston, snowbanks were still on the sides of the streets and sidewalks when the second storm hit on Feb 6th setting new 24 hour (23.6") and total storm records (27.5"). Boston and much of the rest of state simply had no place to put the new snow. Those storms brought the bulk of the snow that year, it would be fun to go back to the climatic records and compute the depth days for each month in 1978 and 1997.
Here are annual summaries from my collaborators and me. Click on the column headings to see data for specific season. Amounts in boldface are either for a complete season or the current season to date.
In each data box, the top number is the number of SDDs for the season, the lower box is the snowfall for the season. While it disagrees with the precision from the reports, I've recorded SDDs to the inch and snowfall to the tenth to make the data easier to read. To keep the table size down, I haven't included the Persistence Quotients.
| Station |
Click on season header for a detailed page for that season. Bold numbers are data for the whole season. |
||||||||||||||
|---|---|---|---|---|---|---|---|---|---|---|---|---|---|---|---|
| 10/11 | 11/12 | 12/13 | 13/14 | 14/15 | 15/16 | 16/17 | 17/18 | 18/19 | 19/20 | 20/21 | 21/22 | 22/23 | 23/24 | 24/25 | |
| Collinsville CT | SDDs: Snowfall: |
|
|
617 58.9 |
1102 67.3 |
|
|
|
|
|
|
|
|
|
|
| Ashland MA | |
|
|
|
|
|
|
|
|
139 34.1 |
386 61.6 |
162 46.2 |
|
|
|
| Fairhaven MA | 259 40.2 |
29 15.2 |
183 46.9 |
173 49.6 |
924 80.4 |
127 35.0 |
81 46.4 |
107 37.0 |
41 19.9 |
29 16.8 |
101 25.1 |
107 31.7 |
12 9.3 |
40 13.0 |
34 13.0 |
| Marlboro MA | 1188 81.7 |
64 24.4 |
484 77.5 |
656 71.1 |
1476 94.9 |
124 37.0 |
280 60.9 |
|
|
|
|
|
|
|
|
| Pepperell MA | 1153 81.7 |
117 38.0 |
698 92.9 |
1019 80.4 |
1604 113.4 |
172 43.2 |
538 93.0 |
494 98.8 |
239 50.9 |
314 59.3 |
426 58.9 |
234 38.9 |
257 62.0 |
148 42.0 |
393 41.7 |
| Poland Spring ME | 1514 98.0 |
305 65.0 |
676 81.5 |
1068 76.5 |
1539 96.8 |
229 30.7 |
1231 115.1 |
551 49.6 |
|
|
|
|
|
|
|
| Bow NH | 1833 88.3 |
337 63.9 |
1086 95.4 |
1928 95.7 |
1789 99.7 |
318 35.0 |
94.9 |
948 88.8 |
878 67.4 |
586 55.8 |
935 61.7 |
578 53.4 |
1047 87.8 |
420 61.7 |
674 50.3 |
| Bristol NH | 1561 92.2 |
271 54.3 |
531 80.8 |
1686 94.4 |
1520 91.1 |
234 29.0 |
1152 99.8 |
1078 93.7 |
1139 83.7 |
631 64.6 |
618 67.4 |
610 55.4 |
614 84.8 |
484 79.3 |
786 66.5 |
| Deerfield NH | |
|
|
|
|
|
|
22.0 |
|
|
|
|
|
|
|
| Penacook NH | 1465 90.4 |
170 49.6 |
505 74.5 |
1398 76.1 |
1215 79.7 |
146 22.5 |
714 81.5 |
736 78.1 |
160 31.0 |
|
|
|
|
|
|
| Sutton Mills NH | |
|
|
|
|
|
|
|
|
297 53.9 |
685 66.4 |
508 57.2 |
597 87.2 |
402 75.6 |
620 54.1 |
| Charlestown RI | 487 49.4 |
21 14.2 |
270 53.4 |
|
|
|
|
|
|
|
|
|
|
|
|
| Woonsocket RI | 1008 68.9 |
25 16.6 |
306 69.9 |
384 59.1 |
|
|
|
|
|
|
|
|
|
|
|
| Mt. Mansfield VT | 10167 181.1 |
5507 126.2 |
7723 141.9 |
8301 170.2 |
9386 174.5 |
3651 102.8 |
10990 214.3 |
2307 66.4 |
14592 80.6 |
|
|
|
|
|
|
| Woodford VT | |
|
|
|
|
|
|
|
|
|
|
|
|
|
2591 162.5 |
| Station |
Click on season header for a detailed page for that season. Bold numbers are data for the whole season. |
||||||||||||
|---|---|---|---|---|---|---|---|---|---|---|---|---|---|
| 97/98 | 98/99 | 99/00 | 00/01 | 01/02 | 02/03 | 03/04 | 04/05 | 05/06 | 06/07 | 07/08 | 08/09 | 09/10 | |
| Collinsville CT | SDDs: Snowfall: |
356 34.2 |
1243 85.1 |
111 30.0 |
1109 94.6 |
381 52.1 |
673 79.1 |
352 67.0 |
245 29.7 |
48.1 |
|
|
|
| Ashland MA | 61 24.0 |
190 28.1 |
544 70.5 |
54 29.1 |
476 86.0 |
199 48.0 |
124 27.1 |
54.5 |
|
|
|||
| S Attleboro MA | 21 11.6 |
50 23.4 |
108 19.3 |
260 48.2 |
31 19.6 |
|
|
|
|
|
|||
| N Berlin MA | 1386 98.5 |
273 47.0 |
868 108.2 |
|
|
|
|
|
|||||
| Fairhaven MA | 9 8.4 |
63 33.4 |
31 13.1 |
98 44.0 |
15 11.7 |
270 60.1 |
139 44.3 |
525 92.7 |
69 31.0 |
16 13.1 |
97 26.8 |
152 35.6 |
194 37.3 |
| Groveland MA | 204 54.2 |
364 2.3 |
833 77.4 |
|
|
||||||||
| Manchester MA | 82 16.3 |
|
|
|
|
||||||||
| Marlboro MA | 294 41.8 |
62 24.5 |
247 30.3 |
1106 89.3 |
86 36.1 |
888 87.3 |
211 46.6 |
685 96.7 |
205 54.6 |
184 32.5 |
423 66.0 |
530 54.5 |
205 56.2 |
| Middleboro MA | 18 41.5 |
20 95.5 |
|
|
|
|
|
||||||
| Milford MA | 96 57.0 |
|
|
|
|
|
|||||||
| Milton MA | 71 26.1 |
77 35.7 |
182 28.6 |
228 64.4 |
28 26.6 |
317 73.9 |
|
|
|
|
|
||
| Milton-BHO MA | 83 40.3 |
682 95.3 |
521 94.2 |
|
|
|
|
|
|||||
| Monson MA | 328 55.8 |
273 52.2 |
|
|
|
|
|||||||
| Newburyport MA | 613 46.2 |
|
|
|
|
|
|||||||
| Pepperell MA | 1287 101.6 |
183 45.6 |
1379 99.0 |
430 52.3 |
841 111.8 |
348 65.6 |
295 49.9 |
1584 99.3 |
978 85.8 |
728 59.3 |
|||
| Sterling MA | 399 55.0 |
356 35.0 |
1612 92.0 |
|
|
|
|
|
|||||
| Sudbury MA | 1369 95.2 |
|
|
|
|
|
|||||||
| E Walpole MA | 67 23.8 |
149 18.1 |
229 28.6 |
|
|
|
|
|
|||||
| Waltham MA | 80 36.3 |
|
|
|
|
|
|||||||
| Poland Spring ME | 556 63.9 |
319 37.3 |
472 56.9 |
2358 111.1 |
667 54.3 |
1811 68.4 |
290 55.9 |
1394 104.3 |
284 43.6 |
878 77.8 |
1729 123.6 |
1220 95.2 |
540 60.2 |
| Bow NH | 1264 99.5 |
428 62.5 |
603 57.1 |
2834 139.2 |
1824 105.8 |
830 70.3 |
|||||||
| Bristol NH | |
|
|
|
|
547 54.6 |
|||||||
| Derry NH | 320 52.9 |
120 24.1 |
204 36.6 |
1520 99.0 |
176 42.0 |
1344 98.8 |
359 47.6 |
|
|
|
|
|
|
| Penacook NH | 474 43.0 |
416 45.6 |
1501 97.6 |
226 45.0 |
1511 84.0 |
504 50.6 |
778 74.6 |
368 48.8 |
354 48.5 |
2565 129.5 |
1282 80.8 |
414 50.1 |
|
| Peterborough NH | 807 124.0 |
|
2.5 |
|
|
|
|||||||
| Plymouth NH | 1737 87.8 |
|
|
|
|
|
|||||||
| Wilton NY | 1115 73.0 |
|
|
|
|
|
|||||||
| Charlestown RI | 16 10.5 |
50 32.9 |
50 13.7 |
177 37.6 |
16 10.7 |
255 59.8 |
177 49.4 |
405 75.4 |
91 27.2 |
21 14.1 |
50 13.9 |
254 49.8 |
203 37.9 |
| Woonsocket RI | 80 19.0 |
|
188 21.2 |
456 57.0 |
|
576 74.5 |
155 42.2 |
479 89.9 |
186 45.3 |
42 20.7 |
218 41.8 |
384 59.1 |
153 38.8 |
| Mt. Mansfield VT | 10370 260.9 |
8742 207.4 |
9407 301.7 |
12695 309.6 |
7428 232.6 |
10940 180.4 |
11272 210.5 |
8221 190.5 |
8079 221.0 |
7869 238.1 |
11973 249.7 |
10235 208.5 |
9240 178.2 |
| Mt. Snow VT | 3894 178 |
|
|
|
|
|
|||||||
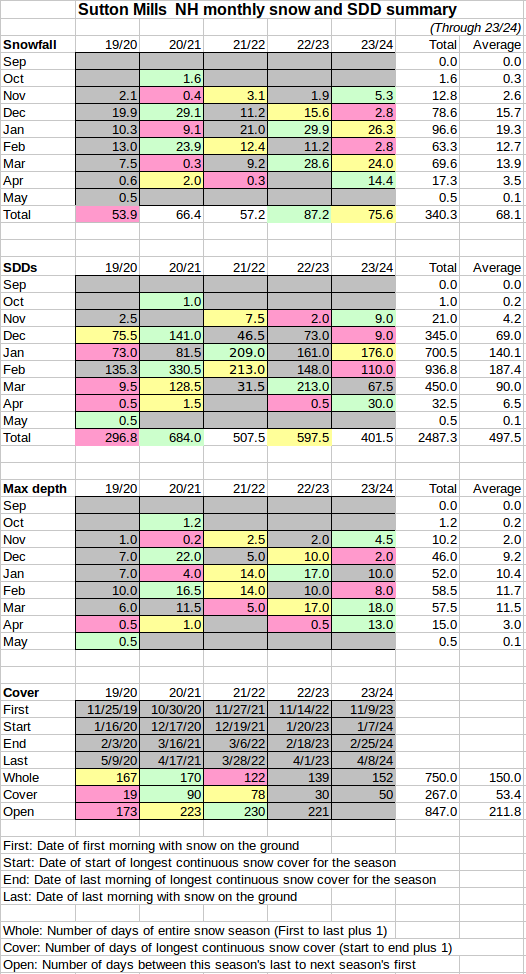
This spreadsheet image shows the monthly data from Sutton Mills, I moved here in 2019. The color shading shows in each row the top two maximum distinct values (i.e. it ignores ties) and the minimum that is not zero. While the first winter looks uniformly disappointing, the next season would look very different had I not gotten 27" on Dec. 17th.
This spreadsheet image shows the monthly data from Penacook for the 20 years or so I lived there. Note how the 2007/2008 remains the most exceptional season. All but two seasons have flagged entries. One that doesn't, 2009/2010, is the only season that had no snowpack for the entire month of March.
| Penacook NH | |||||
|---|---|---|---|---|---|
| Season | December | January | February | March | Total |
| 03/04 | 3 | 11 | 3 | 17 | |
| 04/05 | 8 | 1 | 9 | ||
| 05/06 | 2 | 2 | |||
| 06/07 | 3 | 1 | 4 | 8 | |
| 07/08 | 2 | 1 | 3 | ||
| 08/09 | 1 | 6 | 1 | 1 | 9 |
| 09/10 | 1 | 1 | |||
| 10/11 | 6 | 2 | 1 | 9 | |
| 11/12 | 3 | 3 | |||
| 12/13 | 3 | 3 | |||
| 13/14 | 1 | 6 | 4 | 4 | 15 |
| 14/15 | 7 | 12 | 2 | 21 | |
| 15/16 | 4 | 4 | |||
| 16/17 | 4 | 2 | 6 | ||
| 17/18 | 5 | 7 | 12 | ||
| 18/19 | 2 | 2 | NA | 4? | |
| Sutton Mills NH | |||||
|---|---|---|---|---|---|
| Season | December | January | February | March | Total |
| 19/20 | 1 | 1 | 5 | 7 | |
| 20/21 | 1 | 1 | 2 | ||
| 21/22 | 11 | 4 | 1 | 16 | |
| 22/23 | 3 | 3 | |||
| 23/24 | 0 | ||||
| 24/25 | 1 | 5 | 4 | 10 | |
In Penacook, 2015/2016 was the most spectacularly low snow season. I don't expect to see 22.5" of snow and 146 SDDs again. I had 43-46 inches of snow in three typical low years, but the Snow Depth Days varied between 226 and 474. On the other hand, in Derry, 30 miles south, the snowfall range was 24-44 inches in the same years and SDDs varied between 120 and 204. I'm sure a closer look will show the rain/snow line was often between us. In the 2000/2001 season we each had about 100 inches of snow and 1500 SDDs, suggesting the rain/snow line stayed south of Derry. The 2004/2005 season wound up being a fairly average year in Penacook, but the storm track was so far south that everyone else had more snow. In 2015/2016 storms several storms missed us and we wound up with the least snowfall and SDDs in my data. Eastern Massachusetts residents remembered 2005 for historic storms and a blizzard that paralyzed much of the area in January. 2007/2008 ranged from boring in southern New England to historic in northern New England. Concord NH nearly set a record for the most snowfall for a season. 2011/2012 is memorable for a crippling October snowstorm in some areas and record low snowfall and SDDs just about everywhere during the rest of the season. Late January and most of February 2015 featured another assault on Eastern Massachusetts that made everyone forget 2004/2005. There the story was snow and cold, but New England was cold and snow was slow to melt.
My second full winter in Sutton featured on 2020 Dec 17th some of the heaviest snow ever seen in the region with snowfall rates of 2-3 inches per hour here and higher just a dozen miles north. Ultimately I think I had more than when I was in the Blizzard of '78 in Massachusetts. That it fell in only some 13 hours will have a lot of meteorologists looking for clues to why the snow band formed and stayed put. 2022/2023 was warm with a number of rainstorms, but our NH sites all had more than 80" of snowfall though SDDs varied from 600 to 1000. Fairhaven MA had the least snow and SDDs since the first year of my 25 year record and only 2% of the SDDs of their remarkable 2004/2005 season.
Apparently Mark Twain didn't say "If you don't like the weather, wait a
minute," though he has said quite a bit about
New England weather. Perhaps we can add "If you don't like the weather,
drive an hour."
Contact Ric Werme or return to his home page.
Last updated 2025 Apr 7