A small company in Colorado, Emporia Energy makes an inexpensive but rather nice electrical power monitor, their "Vue." I have their base unit, which has inductive pickups for the power main coming into the house, and their expansion unit that looks at eight individual circuits. I have it looking at my several 240 volt circuits and some 120 volt circuits of interest.
The main impetus for was to understand the electricity used by my mini-split heat pump and the electricity (and propane) used by propane space heater. Ideally I'll learn if I should turn up the heat on the propane unit downstairs to reduce the load on the heat pump.
Emporia's software is adequate for some purposes, mainly looking at realtime energy use on a cell phone app, but it's not good for graphing energy use over time or week by week. There is a mechanism to tell the app to tell the cloud to Email me the entire history at one minute and hour resolution. That will turn into big files, but doesn't give me access to the one second resolution the app displays by default, at least not yet.
However, the per minute data is a good base to generate graphs over a week's time, especially since I readily include temperature data. I sample that every 10 minutes, so I'm also taking the per minute data from Emporia and reducing that down to 10 minutes too, and that's what I'll be displaying here, eventually.
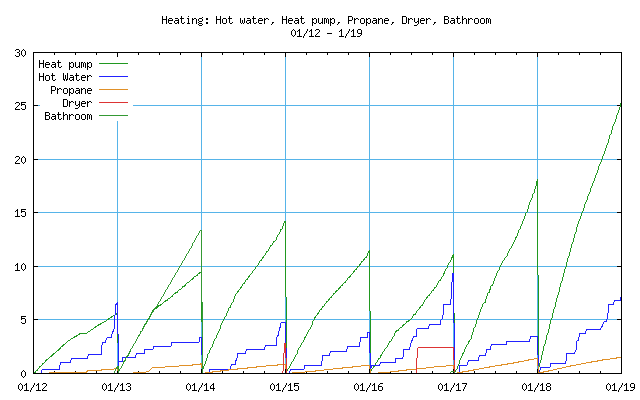
Here's a early heating data sample for a recent week. The graph shows the accumulated kWh during the day, and resets at midnight. If I showed the kW instead, the graph would be spiky and many would have a variable height. This both keeps the lines neater and makes it easy to see how much an event like running the clothes dryer costs.
The traces are generally top-down on both the key and the graph:
Heat pump
The data is from January which was rather mild in 2020. The 12th was in a thaw with
temperatures ranging from 27° to 63°F. At the end of the week, temperatures
were nearly 40 degrees colder, from 0° to 16°F. Some of the kinks in the trace
are from turning off the bedroom unit during much of the day.
Hot water
This draws some 4.7 kW when it runs, this trace may convince me to use the
dishwasher and take shorter showers! I often have a shower late in the
evening, as in the 12th and 17th. The water heater also usually runs due to
washing clothes, or when it's been idle, and hence cooling, for a while.
Propane
This shows when the propane furnace is running, propane consumption should be nearly
proportional to its electricity consumption. Project for the future.
Dryer
This is the clothes dryer, the hungriest power consumer in the house. It
dries things pretty quickly, so the box-like shape on the 16th means it
used a lot of energy midday, but then none for the rest of the day. A
couple kWh per load of clothes. Not bad.
Bathroom - electric baseboard heat
Electric baseboard heat is inexpensive to install, expensive to run. I generally
have it on while I'm taking a shower, as it provides a good reference to look for in these
traces. However, I forgot to turn it off on the 12th and it ran all day on the 13th. While
the "curve" is a straight line, the duty cycle was a little below 50%. Otherwise, the
1 kW heater would have logged 24 kWh instead of 13 kWh it got. Oh well.
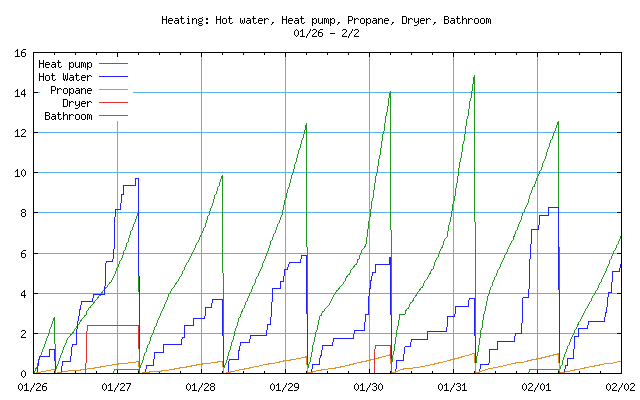
Here are a pair of graphs with some cleaner data. On both of these, I've reset the accumulation at 6 AM as I generally go to bed after midnight. The second graph is new and shows lower energy devices related to water use.
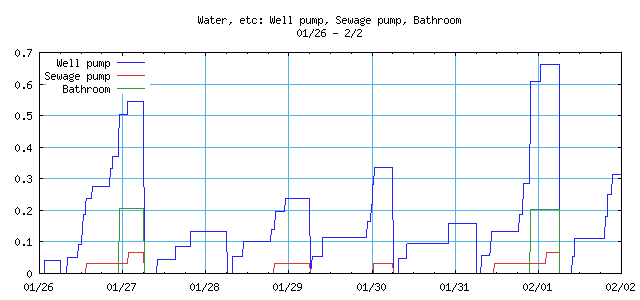
Well pump
I have a drilled well, some 200 feet deep, but very high water tables
around may make it easy to pump the water to the surface. However,
pumping that up to the 60 PSI or so in the water tank is a lot of
work.
Sewage pump
Yep, the leach field is uphill from the house. While I had evidence that
the pump works because the septic system doesn't back up into the house,
it's nice to see that the pump actually does run! Note that it moves
pretty much all the water that comes from the well, and more, but it only has to lift
it about 20 feet, so it doesn't have to work very hard.
Bathroom
This is just a repeat from the heating graph, in part to highlight shower
times but also to provide a comparison in energy consumption. It looks
like I had a shower on the 29th but forgot to turn on the heater.
The high heating day starting on the 30th had a temperature range between 10° and 35°F. Chilly, and cost about 15 kWH, which is a lot less than the 25 kWh on the 18th.
Contact Ric Werme or return to his home page.
Written 2020 Feb 1, last updated 2020 Feb 2.